
The speed, performance, and reliability of your site matter a lot when it comes to e-commerce, online businesses, and the ranking of the site. Every developer tries to optimize the site to increase efficiency, speed, etc. In this article, we’ll be looking at comparisons when LiteSpeed Cache is disabled and after enabling it again. We’ll check the speed from PageSpeed Insights and GTmetrix and compare them with when LSCache is disabled.
Disabling LSCache of the Site
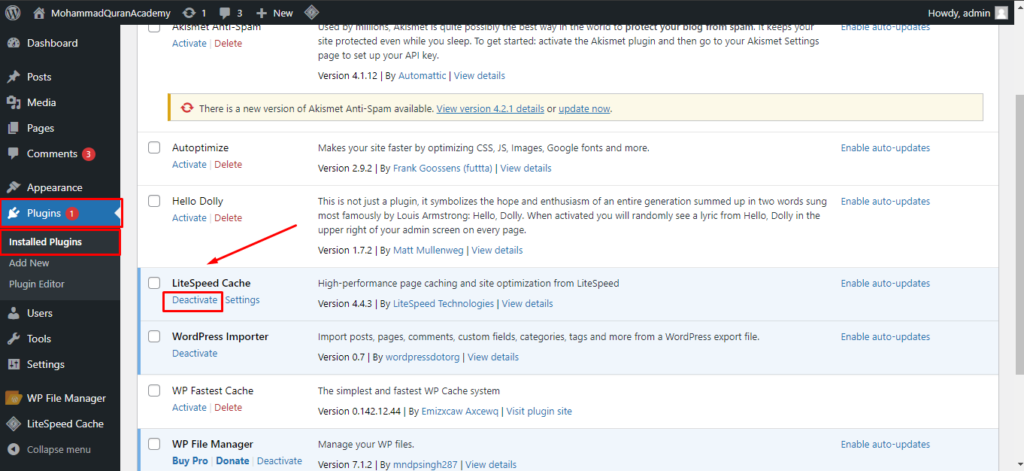
First of all, disable the LSCache plugin from the WordPress dashboard plugins setting. Go to your WP dashboard and navigate to Plugins -> Installed Plugins. Scroll down, you’ll see the LiteSpeed Cache plugin activated. Click on Deactivate to disable it.
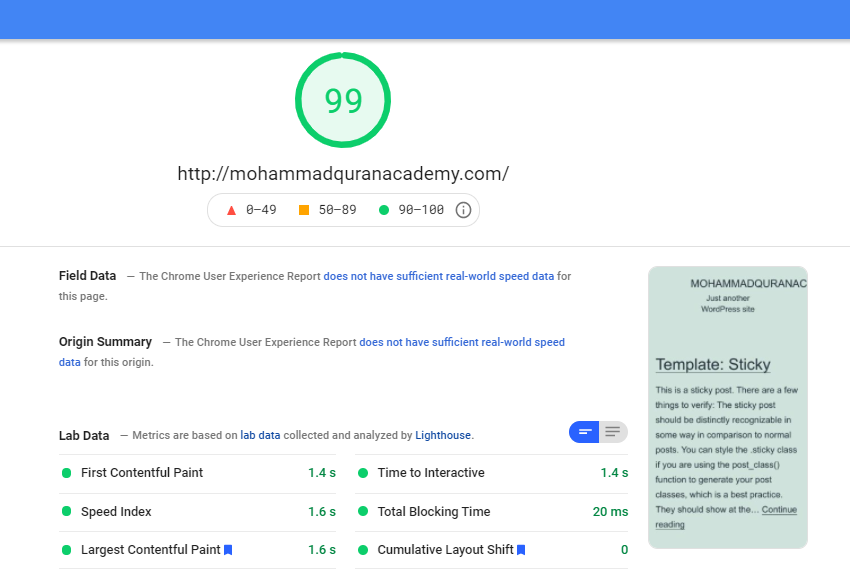
Now go to PageSpeed Insights and enter your domain to see results
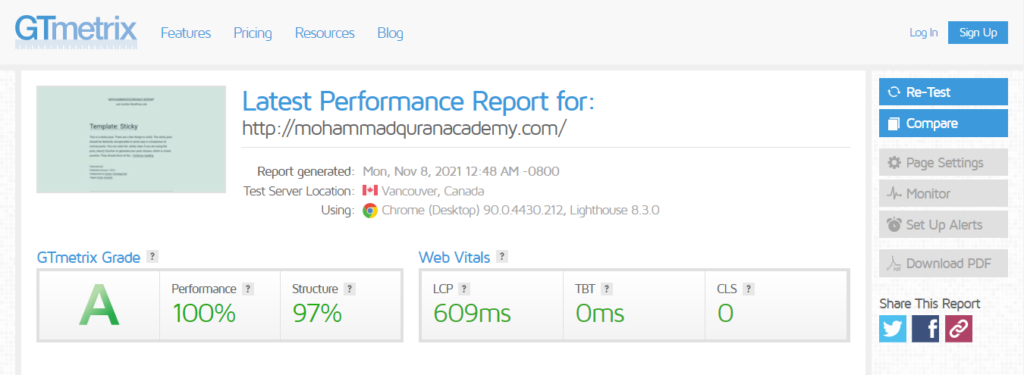
To be sure about your site’s performance, we will also use another performance check tool GTmetrix. Go to their site and enter your domain to see results.
We will look at the metrics and differences in the last section of our article, for now, let’s enable back the plugin and again see the results.
Enabling Back LSCache of the Site
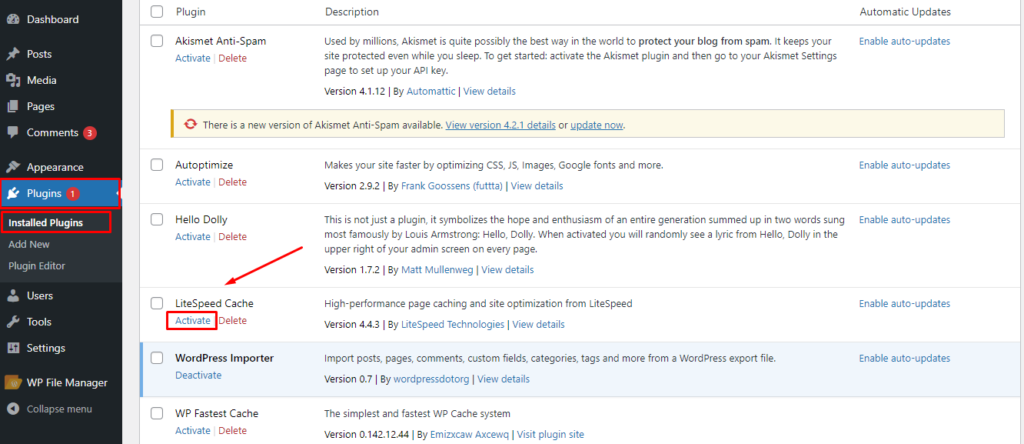
To enable the plugin, just go to the installed plugins and activate the plugin.
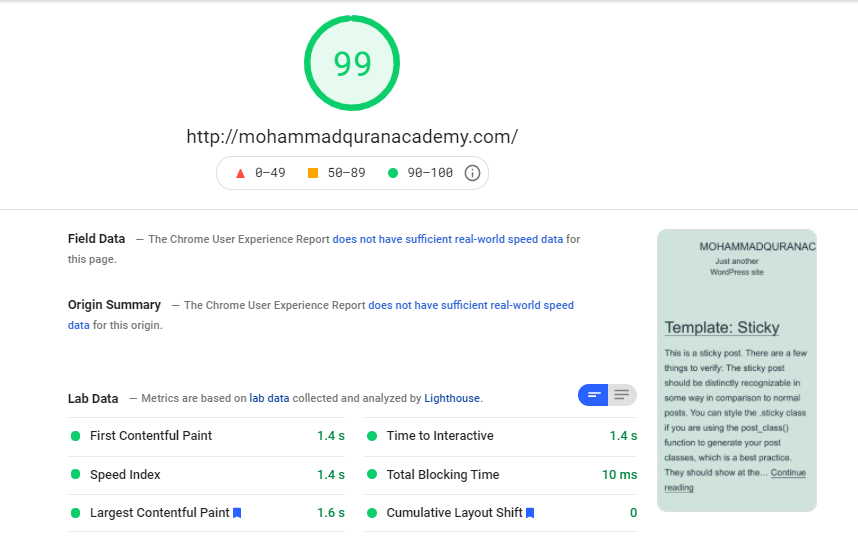
Now check your results on PageSpeed Insights.
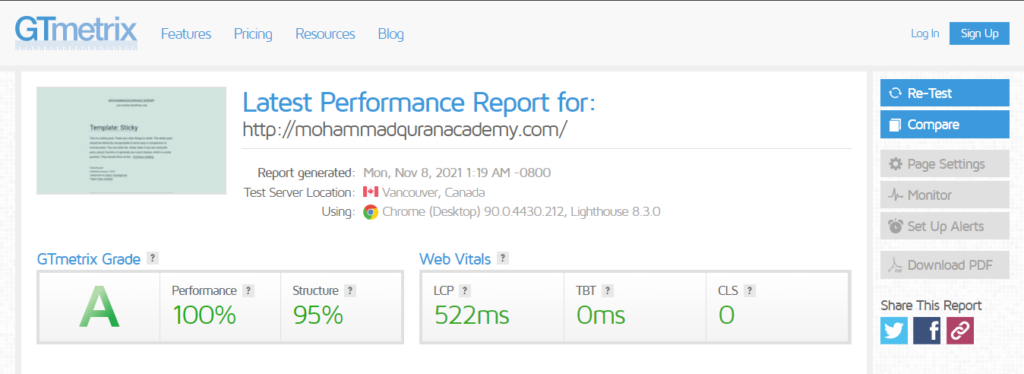
Similarly, also check the result on GTmetrix to see the difference.
Comparing the Results
Now it’s time to see and compare the results when LiteSpeed Cache was disabled and when it was enabled.
Metrics
- First Contentful Paint: FCP measures how long it takes the browser to render the first piece of DOM content after a user navigates to your page. Images, non-white
<canvas>elements and SVGs on your page are considered DOM content; anything inside an iframe isn’t included. One issue that’s particularly important for FCP is font load time.
- Time to Interactive: TTI measures how long it takes a page to become fully interactive. A page is considered fully interactive when page displays useful content, event handlers are registered for most visible page elements, and the page responds to user interactions within 50 milliseconds.
- Speed Index: Speed Index measures how quickly content is visually displayed during page load. Anything you do to improve page load speed will improve your Speed Index score.
- Total Blocking Time: TBT measures the total amount of time that a page is blocked from responding to user input, such as mouse clicks, screen taps, or keyboard presses. The sum is calculated by adding the blocking portion of all long tasks between First Contentful Paint and Time to Interactive. Any task that executes for more than 50 ms is a long task. The amount of time after 50 ms is the blocking portion. For example, if Lighthouse detects a 70 ms long task, the blocking portion would be 20 ms.
- Largest Contentful Paint: LCP measures how long it takes for the largest content element (e.g. a hero image or heading text) on your page to become visible within your visitors’ viewport. LCP is an easy metric to understand as all you need to do is look at your webpage, identify the largest text block or image, and then optimize its load time.
- Cumulative Layout Shift: CLS measures the unexpected shifting of web elements while the page is being rendered. This measurement is then quantified as an aggregate score of all the individual layout shifts on your page.
Now that you know what each metric means let’s dive into the comparisons.
PageSpeed Insights Comparison
| LiteSpeed Cache is disabled | LiteSpeed Cache is enabled | |
| First Contentful Paint (FCP) | 1.4 sec | 1.4 sec |
| Time to Interactive (TTI) | 1.4 sec | 1.4 sec |
| Speed Index | 1.6 sec | 1.4 sec |
| Total Blocking Time (TBT) | 20 ms | 10 ms |
| Largest Contentful Paint (LCP) | 1.6 sec | 1.6 sec |
| Cumulative Layout Shift (CLS) | 0 sec | 0 sec |
GTmetrix Comparison
| LiteSpeed Cache is disabled | LiteSpeed Cache is enabled | |
| Largest Contentful Paint (LCP) | 609 ms | 522 ms |
| Total Blocking Time (TBT) | 0 ms | 0 ms |
| Cumulative Layout Shift (CLS) | 0 sec | 0 sec |
Final Thoughts!
Well, that’s a pretty impressive difference there. LSCache does its job really well. You can see how the metrics are improved with LSCache enabled, this is really good for larger sites especially for e-commerce sites as the performance, reliability, stability matter a lot for a web admin, web developer, and owner.
Not only these metrics are used for improving site performance and efficiency, but they are also effective for site ranking somehow.
To become a partner with CyberLoader Click here.