
Here in this article, I’m going to discuss Linux Commands and Tools to monitor your server performance. This will help every Linux user to analyze issues and improve performance.
It is really very tough for any Network and System Administrator to debug and monitor the Linux system Performance problem every day, In this article, I will come to basic monitoring commands and discussed that you are well-known tools for monitoring and analysis. These commands are available under all flower of Linux and can be useful to monitor and find the actual causes of performance problems.
To become a partner with CyberLoader Click here.

Some Linux Commands and Tools to monitor
1. Top
So the first command I want to discuss with you is top. this is a Linux monitoring command, top command display Linux processes it provides a dynamic real-time view of a running system actual process activity by default it displays the most CPU intensive tasks running on the server and displays all the burning and active processes in an ordered list and updates it regularly that every 5 seconds, and it displays the CPU utilization the CPU usage on the system the memory usage that the spot memory and Cache Size, Buffer Size, Process PID, User, and much more. It also shows high memory and CPU utilization of running processes. The top command is much useful command for the system administrator to monitor the server.
# top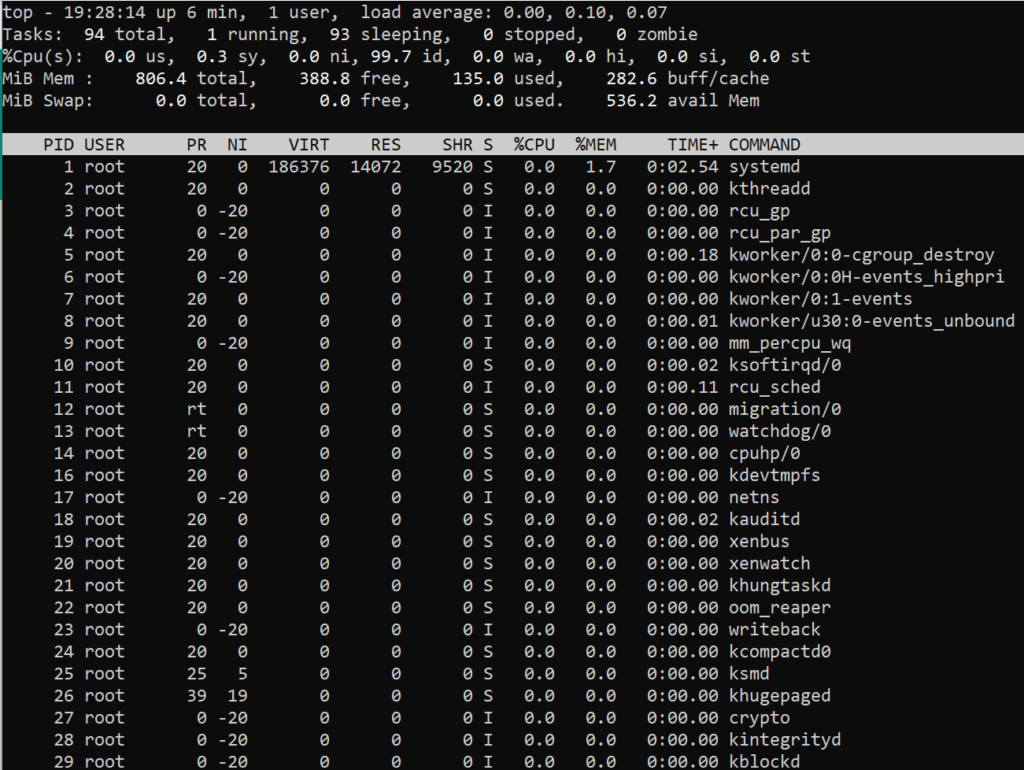
2. VmStat
The second one is VMStat, this command reports information about processes, memory, paging block, I/O blocks, and CPU activity. This command displays the statistics for virtual memory and also kernel threads.
# vmstat
3. Free
The Next Command is free, this command shows the total amount of free and used physical and swap memory in the system as well as the buffers used by the kernel. In LINUX, there is a command-line utility for this.
# free
4. Iostat
The iostat command reports central Processing Unit statistics and input-output statistics for device partitions and network file systems. iostat is a simple tool that will collect and show system input and output storage device statistics. This tool is often used to trace storage device performance issues including devices, local disks, remote disks such as NFS.
# iostat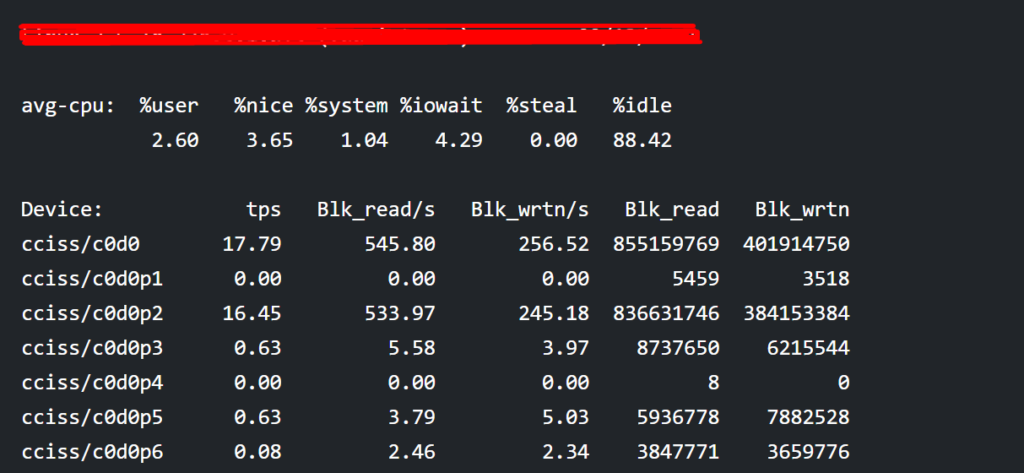
4. Netstat
Netstat is a command-line tool for monitoring incoming and outgoing network packet statistics. Netstat command displays network connections, routing tables, interface statistics, masquerade connections, and multicast memberships. It is a very useful tool for every system administrator to monitor network performance and troubleshoot network-related problems.
# netstat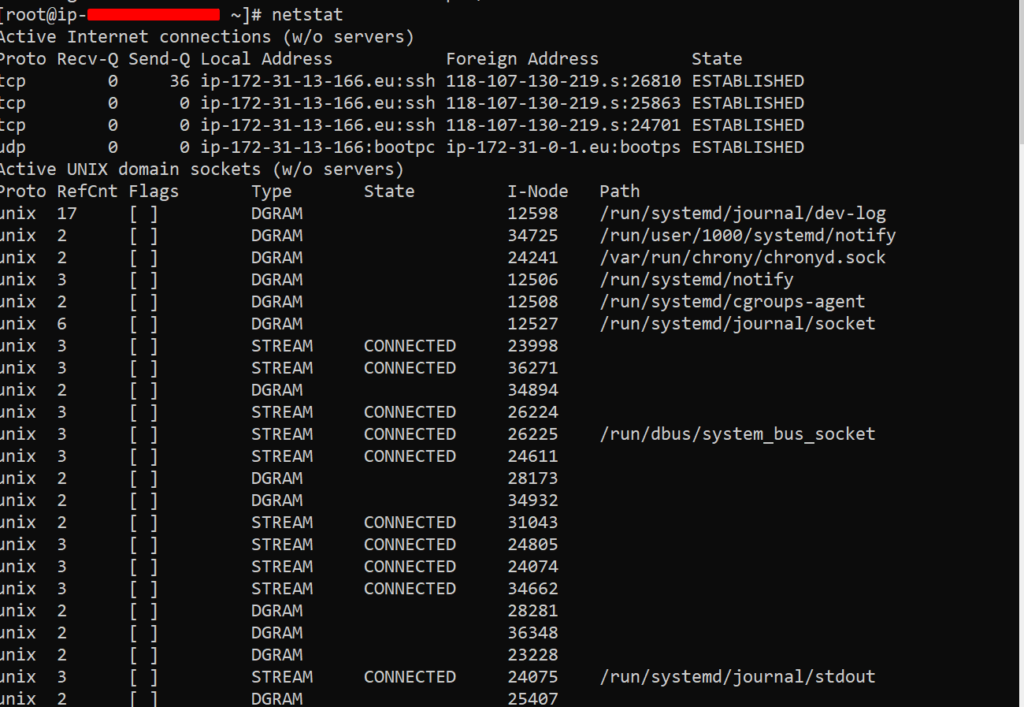
5. Iotop
The next one is Iotop, this command monitors I/O usage information using the Linux Kernel it shows a table of current I/O usage it sorted by processes of threads on the server. it is much similar to the top command, but it has an accounting function to monitor and display real-time Disk I/O and processes.
# iotop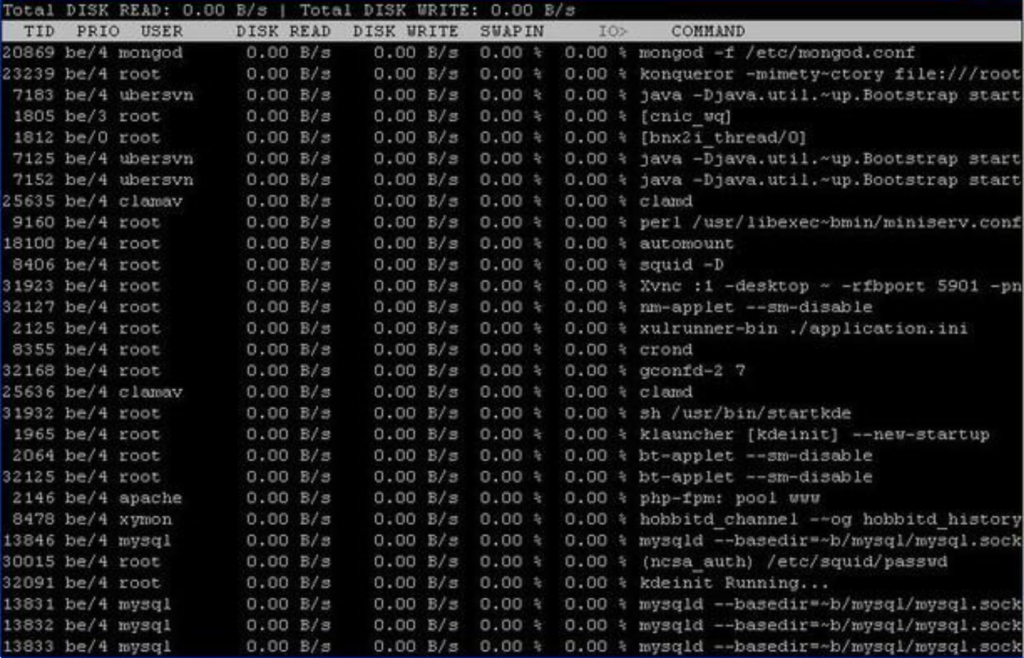
6. Htop
The next one is htop one of the most advanced tools for monitoring htop is a free and open-source and process-based process view of a Linux it is much better than top command very easy to use and you can select processes for killing organizing without using the process ID is on leaving htop interface.
# htop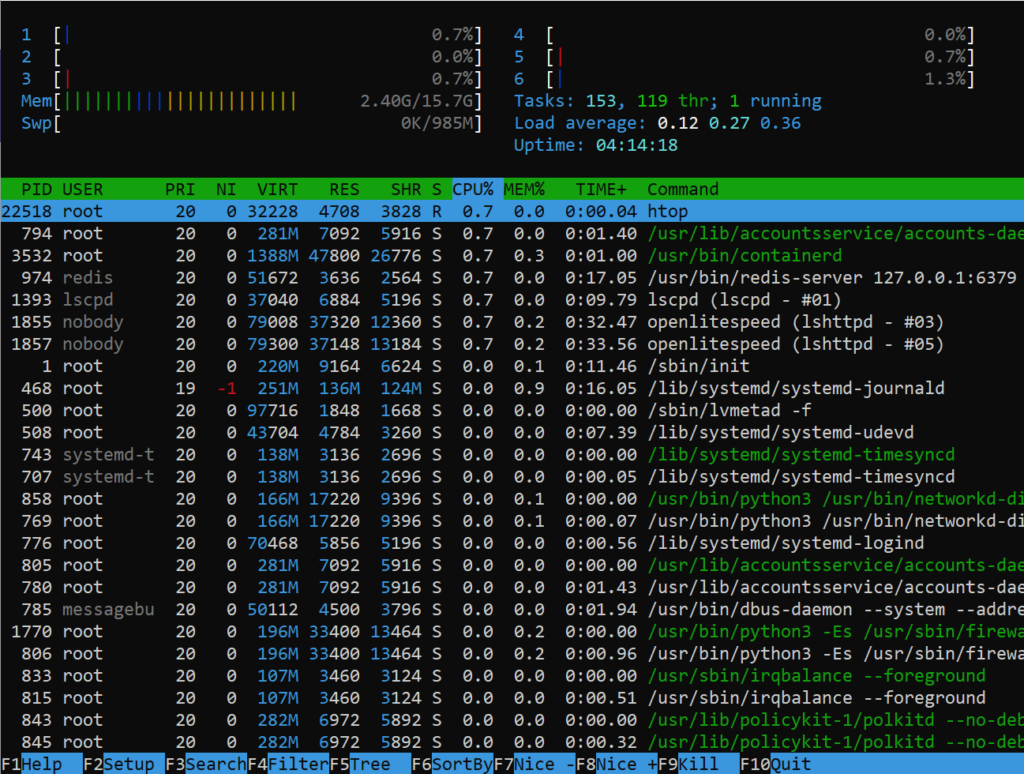
7. Atop
Atop it is a very powerful and interactive monitor to view the load on a Linux system it displays the most critical hardware resources from a performance point of view you can quickly CPU memory disk and network performance it shows which processes are responsible for the indicated load concerning CPU and memory load on the process level.
# atop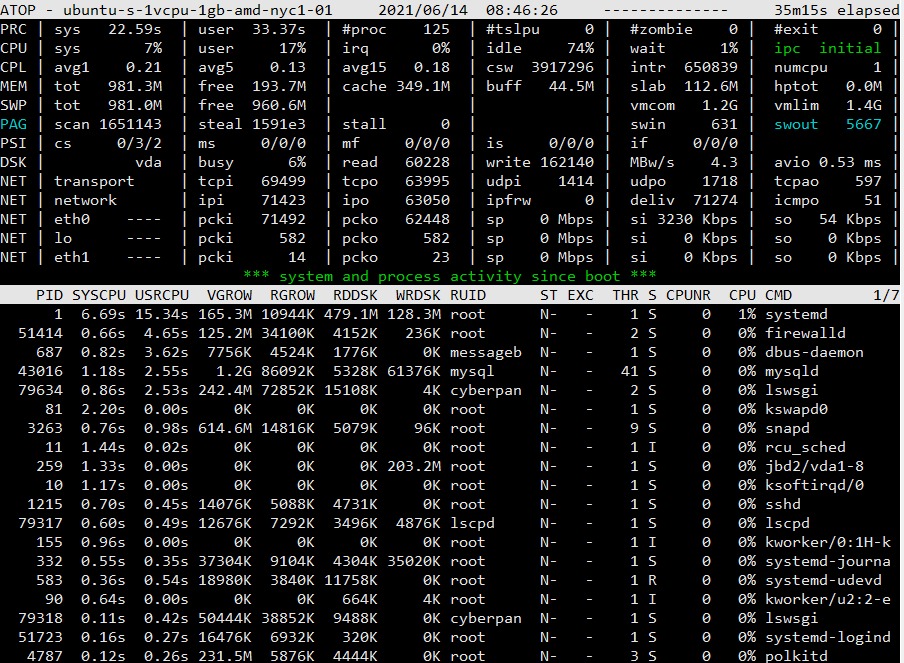
There are also some extrnal tools which helps you to analize and improve the performance like new Relic read more about New Relic
Follow CyberLoader on Facebook / Twitter.
Join our Facebook group.
How to perform a Stress Test on your Web application using CyberLoader?